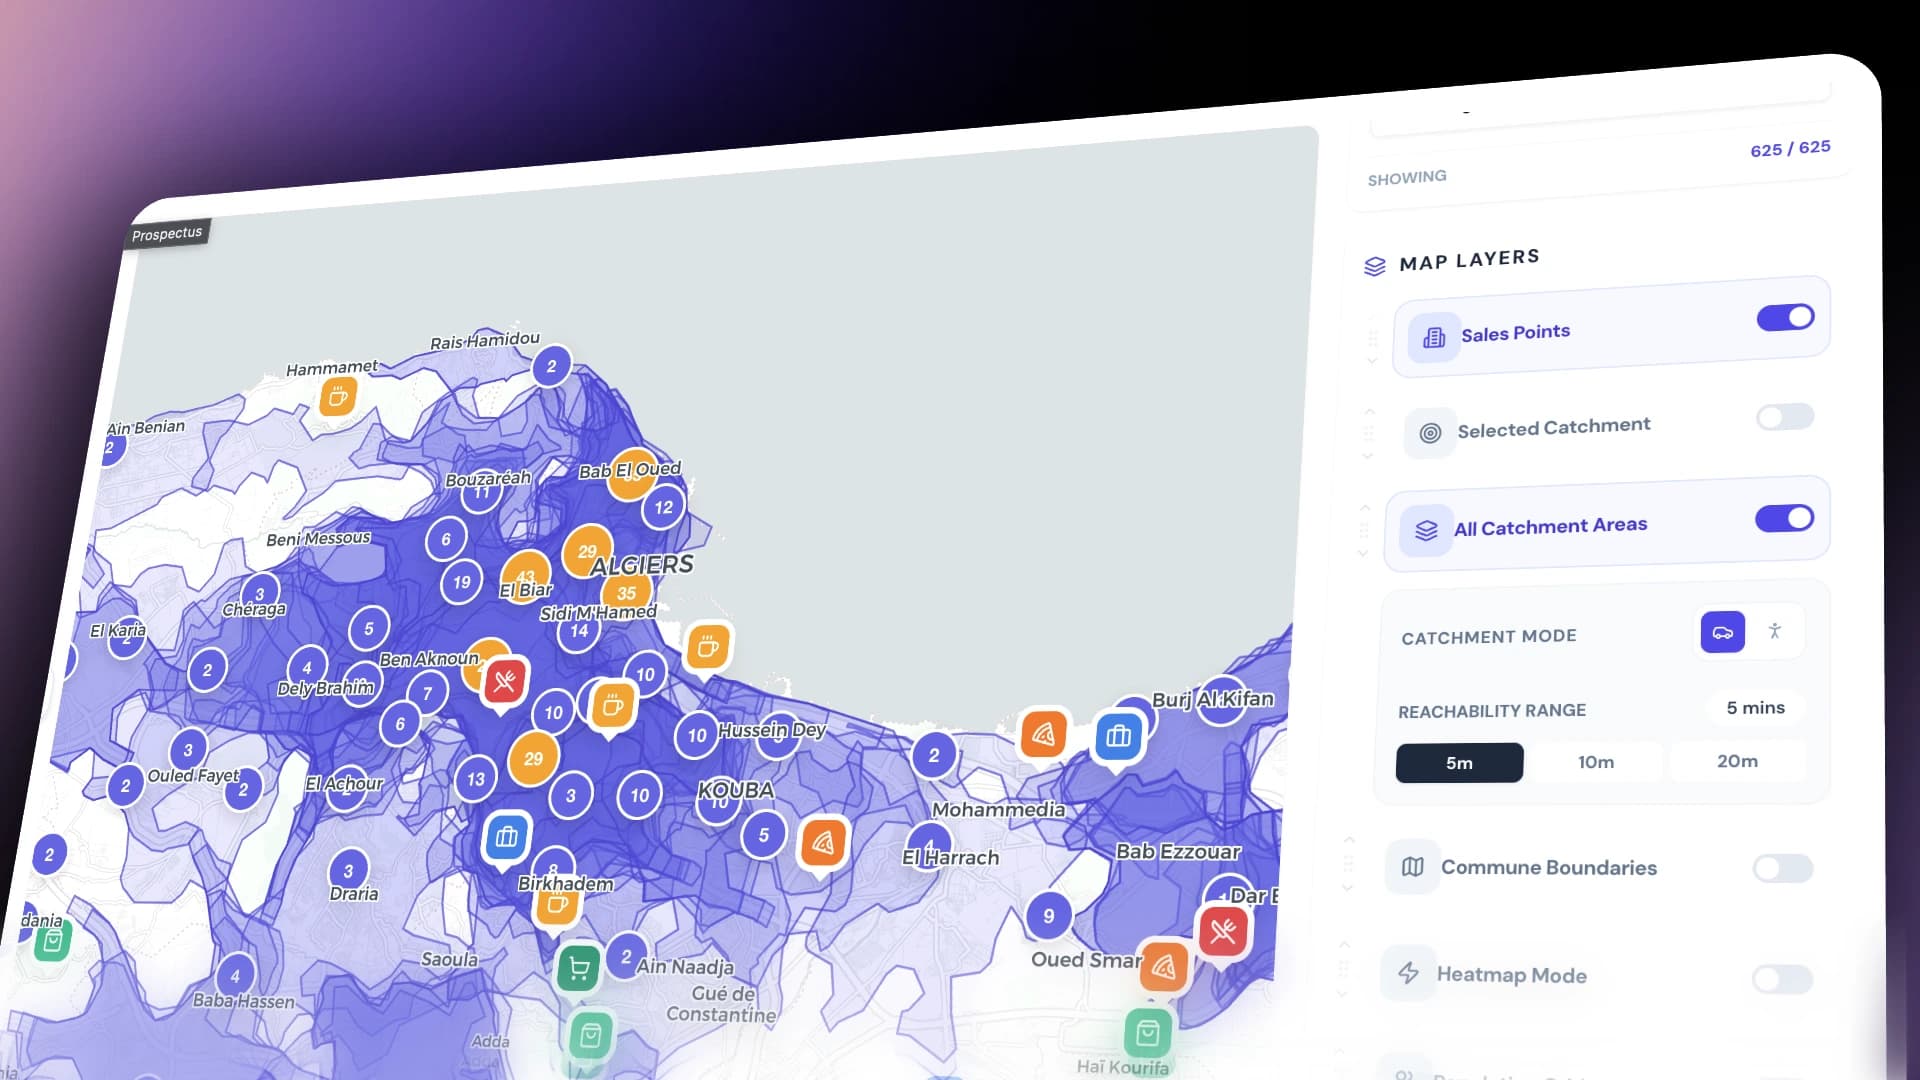
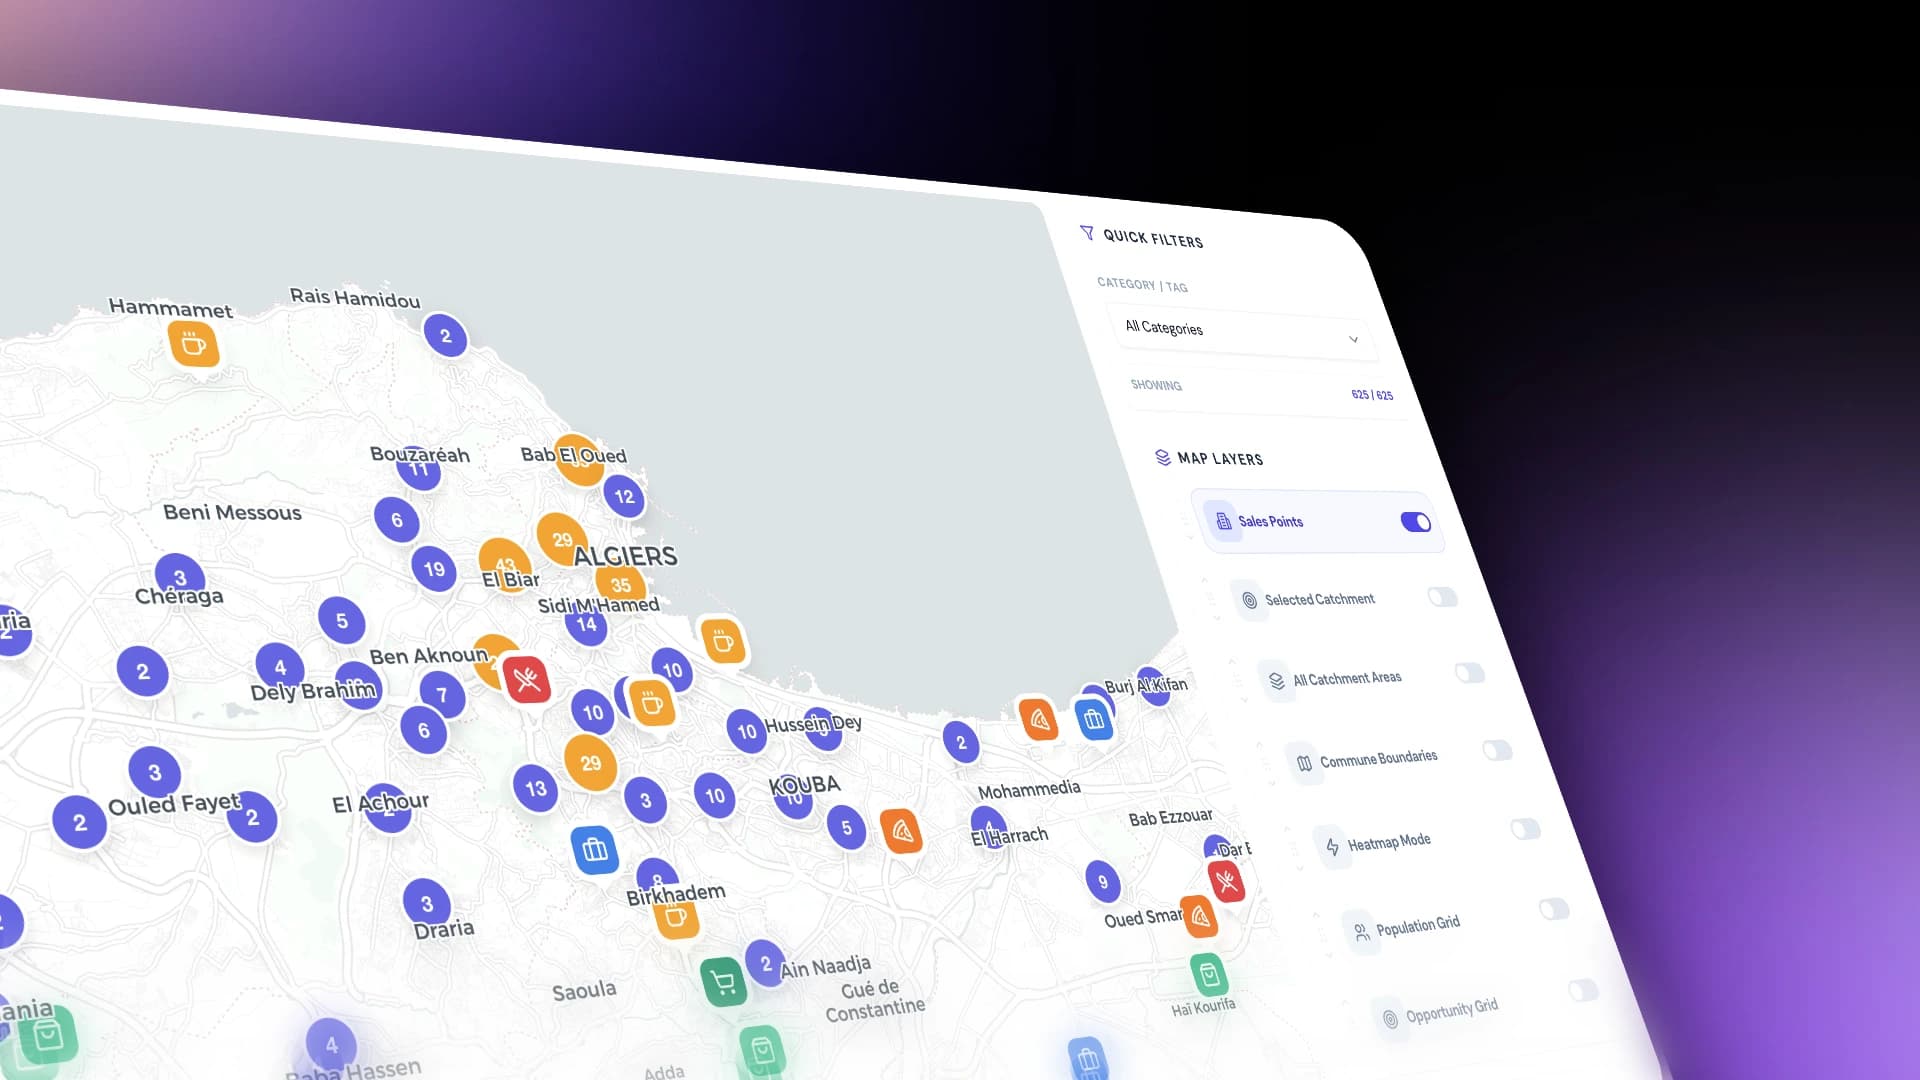
Engineering a High-Performance Geospatial Engine
1. Executive Summary & Problem Context
- Where are the white spaces (untapped markets with high population density but zero store coverage)?
- Which retail partners are cannibalizing each other due to overlapping drive-time catchment zones?
- How can a field sales force visualize 50,000+ retail outlets, communes, and census population grids at 60 FPS without crashing the browser?
[The Naive Web GIS Bottleneck]
Database (50k Points) ──(50MB GeoJSON Payload)──> Browser DOM (50,000 SVG Markers) ──> 2 FPS Crash

[Prospectus Multi-Tier Spatial Architecture]
Database & Census Data ──[ RBush 2D R-Tree ]──> Fast Bounding-Box Pruning (O(log N))
                                │
                      [ Supercluster Engine ] ──> Viewport-Clustered GeoJSON (under 100KB)
                                │
                 [ Isoband Gap Opportunity Modeler ]
                 (5x5 Blur + Douglas-Peucker Simplification)
                                │
                        [ React-Leaflet ] ──> 60 FPS Smooth Canvas / Cached DivIcons
The Mission
- Sub-10ms bounding-box spatial queries over hundreds of thousands of population census points.
- Server-side hierarchical clustering (Supercluster) delivering lightweight payloads per viewport.
- Multi-modal drive-time and walk-time isochrones (5, 10, 15, 30 mins) with spatial cannibalization detection.
- Continuous mathematical opportunity surface generation using Marching Squares isobands and multi-pass blur kernels.
- Smooth 60 FPS interactive frontend rendering with pre-rendered HTML icon caches and 5-minute RTK Query viewport caching.
2. Spatial Engine Architecture & Domain Decomposition

2.1 Domain Sub-Services Overview
- PopulationService: Manages the national census population point cloud. Builds an in-memory 2D R-Tree (RBush) on startup and a Supercluster index for zoom-aware population heatmaps.
- OpportunityService: Calculates commercial opportunity grids. Computes ambient population density quartiles ($Q_1 \dots Q_4$), resolves 75th percentile benchmark sales rates, executes spatial overlap factor division, runs 5x5 blur smoothing, and generates smooth contour polygons via turf.isobands.
- CatchmentAreaService & CatchmentGenerationService: Fetches, persists, and queries multi-polygon isochrone catchment areas (driving-car, foot-walking).
- CompetitionScoreService: Evaluates competitor proximity, trade zone overlap, and market saturation scores for any arbitrary polygon.
- CommuneService: Caches and indexes administrative district boundaries and precomputes regional population densities.
3. Core Algorithms & Computational Optimizations
3.1 Sub-Millisecond Point-in-Polygon via RBush 2D R-Tree
Problem Statement
Solution: Two-Phase Bounding-Box Pruning
- Phase 1: Bounding-Box Spatial Filter ($O(\log N)$): The geometry's envelope [minLng, minLat, maxLng, maxLat] queries the R-Tree to eliminate $>98%$ of candidate points in under 1ms.
- Phase 2: Exact Point-in-Polygon ($O(K)$ where $K \ll N$): Ray-casting (@turf/boolean-point-in-polygon) is executed only on the small subset of candidate points.
Typescript
[Query Performance Benchmark]
Full Array Scan (200k points): ────────── 480ms
RBush Pruned Query (1.2k candidates): ──── 4.2ms  (114x Speedup 🚀)
3.2 Dynamic Server-Side Viewport Clustering (Supercluster)
Problem Statement
Solution: Zoom-Aware Supercluster Pipeline
Typescript
[Viewport Data Payload Reduction]
Zoom Level 10 (City View):    4,800 Points ──(Clustered)──> 42 Cluster Nodes (98.8% Payload Reduction)
Zoom Level 14 (District View): 350 Points ──(Clustered)──> 28 Clusters + 45 Pins
Zoom Level 16 (Street View):   Individual Company Pins Rendered with Rich Dossier Tooltips
3.3 The Commercial Opportunity Gap Engine

Step 1: Overlap Sharing & Cannibalization Mathematical Model
Effective Population Per Store = Cell Population / k

Expected Orders = Sum( (Cell Population / k) * Reference Rate_i )

Gap Ratio =
  • 1.0 if k = 0 (Unserved White Space)
  • (Expected Orders - Actual Orders) / Expected Orders if k >= 1
Step 2: Unified Continuous Z-Value & 5x5 Moving Average Kernel
Typescript
Step 3: Marching Squares & Douglas-Peucker Simplification
- HOT (Red, Gap $>60%$): High population, unserved white space.
- WARM (Orange, Gap $30%\dots60%$): High potential, under-performing retail coverage.
- NEUTRAL (Yellow, Gap $10%\dots30%$): Balanced equilibrium.
- BLUE (Sky Blue, Gap $-15%\dots+10%$): Oversaturated market.
- BLUE_DEEP (Deep Blue, Gap below -15%): Severe store cannibalization.
4. Frontend Map Rendering Architecture & 60 FPS Optimizations
1. Pre-Rendered DivIcon HTML Cache
Typescript
2. Viewport-Debounced RTK Query Caching (keepUnusedDataFor: 300)
3. Container ResizeObserver Isolation (MapResizer)
5. Architectural Decisions & Trade-Offs
6. Key Improvements & Refactoring Evolution
[Phase 1: Monolithic Spatial Endpoint]
- 1,200-line SpatialController executing full database scans.
- Client downloaded raw CSV population points.
- Map frame rate dropped to 12 FPS during zoom.

                 ⬇ [Deep Modularization & Indexing Refactor]

[Phase 2: Production Sub-Millisecond Spatial Engine]
- Modularized into 6 specialized domain services (<450 lines each).
- Startup RBush 2D R-Tree building (<25ms initialization).
- Unified gapRatio isoband engine with 5x5 smoothing kernel.
- RTK Query 5-minute spatial cache + Leaflet DivIcon string caching.
- Maintained solid 60 FPS pan/zoom performance across all devices.
7. Performance Benchmarks & Business Outcomes
┌────────────────────────────────────────────────────────┐
│               SPATIAL ENGINE BENCHMARKS                │
├────────────────────────────┬───────────────────────────┤
│ 200k Point PIP Query       │ 480ms ──> 4.2ms (114x)    │
│ Viewport GeoJSON Payload   │ 15MB  ──> 85KB (99.4%)    │
│ Map Frame Rate (Pan/Zoom)  │ 14 FPS ──> 60 FPS Solid   │
│ White-Space Identification │ Automated in < 50ms       │
│ Cannibalization Precision  │ 100% Deterministic (k)    │
└────────────────────────────┴───────────────────────────┘
- Strategic Territory Planning: FMCG brands using Prospectus identified high-value distribution expansion zones in seconds rather than weeks of GIS consultancy.
- Deterministic Cannibalization Detection: Automated $k$-overlap math prevents overlapping retail franchisee conflicts.
- Flawless Client UX: Sales reps navigate seamless vector heatmaps, isochrones, and outlet clusters with zero stutter.
8. Summary Checklist for Portfolio Reviewers
- [x] Advanced Data Structures: 2D R-Tree (RBush) + Hierarchical Quadtrees (Supercluster).
- [x] Computational Geometry: Marching Squares (turf.isobands), Ray-Casting PIP, Douglas-Peucker simplification.
- [x] Full-Stack Optimization: NestJS modular sub-services + PostgreSQL grid caching + React-Leaflet canvas rendering.
- [x] High-Performance Frontend: Cached HTML strings, debounced viewport subscriptions, and RTK Query normalized caching.